The First Ball of the Over.
Like many things I do, this piece started with me asking a stupid question. Unlike many of my projects, though, that wasn’t the best part. It is well established that across the history of T20 cricket, the first ball of any given over is one of the least likely to go for a boundary. This is generally attributed to the batter wanting a ‘sighter’, a chance to see what the bounce is like and the bowler’s pace, etc.
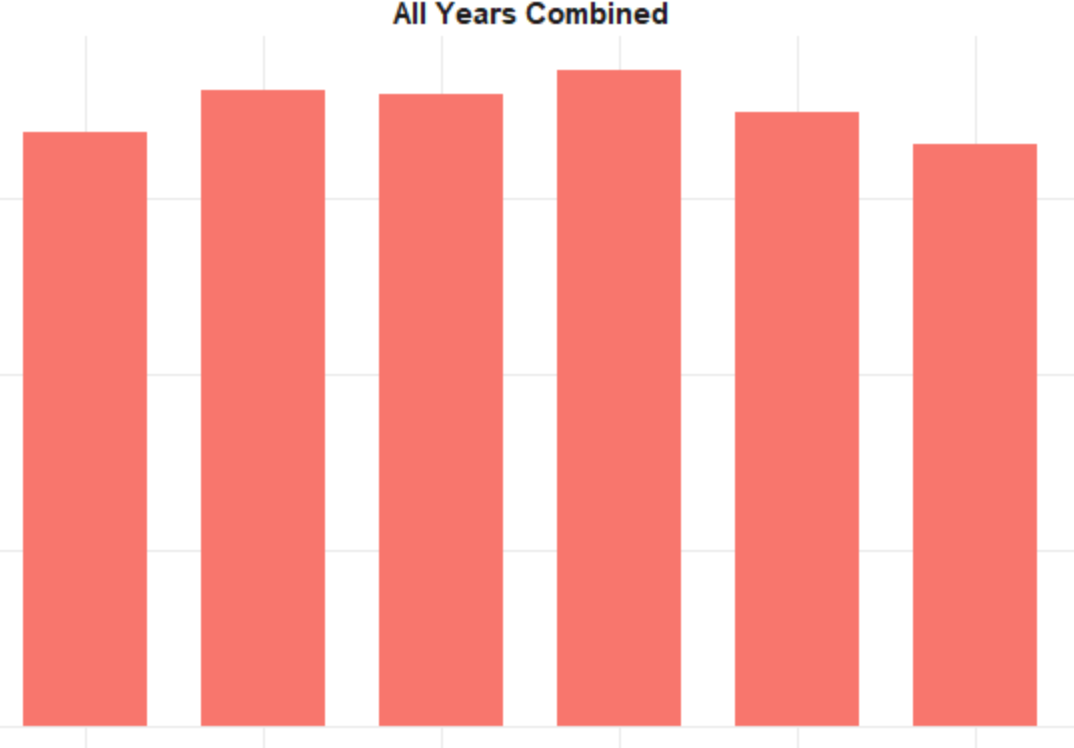
Graph 1: Spread of Runs per ball of the over across 295,000+ IPL Deliveries. Each bar represents a legal ball number, from 1 to 6. The shape of the distribution is the only part relevant to us here: we see across the huge dataset there is a clear dip for ball 1, and a tail-off at 6 too.
The stupid question I asked then was… “if an over is only 5 balls long in The Hundred, which ball did they remove from the over?” The answer, if you’re interested, is one of the middle four. Over the course of The Hundred so far, the run distribution shows the same first and last ball reductions as 6-ball leagues. Honestly though, that analysis is only worth a footnote. More interestingly, I was using the IPL as my standard benchmark for “normal T20 cricket” to compare it against… and I stumbled onto this.
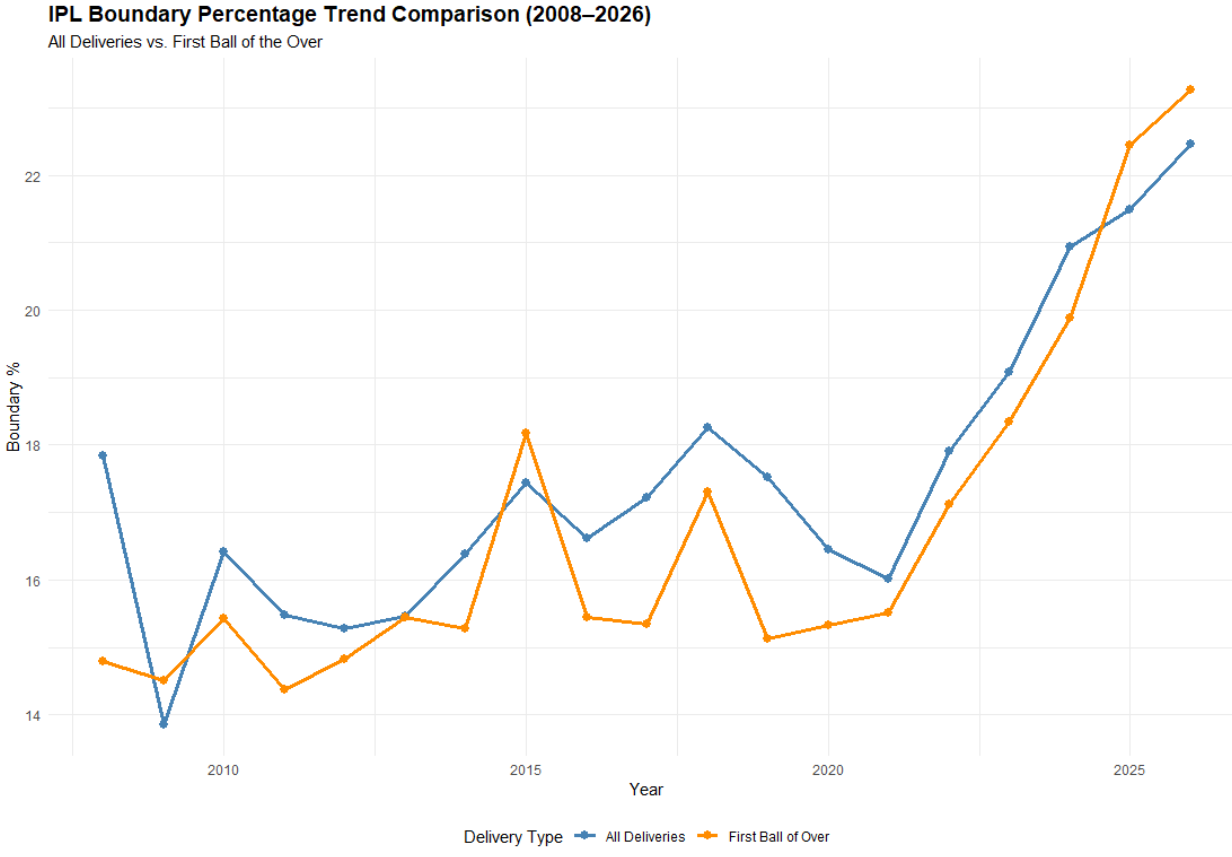
Graph 2: IPL year-by-year data for all games. Orange represents the % of balls hit for boundaries on ball 1 of the over, while blue represents the average for all balls. Each node is a season.
Here you can see, barring a few outliers, the first ball of the over in orange goes for a boundary less often than the average ball in blue. That is… until 2025 and 2026, where the long-held truism has failed two years in a row… Why?
A global revolution, or an IPL quirk?
As you can see from 2021 to 2024, the attitude to the first ball didn’t change, which is to say the gap between first ball rates and rest-of-the-game rates was similar. But the total season boundary count has soared from a 2021 dip of around 15% up to 21% in 2024. The impact sub rule introduced in 2023 certainly helped contribute to this, but so did the production of flatter pitches and a broader mentality shift among players and coaches as to what was an acceptable score. After this, the rate of acceleration of boundary hitting has slowed down, but they’ve found disproportionate gains in the first ball. I think a very plausible hypothesis is that now that scores are regularly 200+, teams have turned their attention to every pocket of opportunity available to score more… and they’ve found that the first ball is holding some unexplored value. This may be a subconscious shift too; I’m not suggesting the teams looked at these graphs and told their batters to start hitting from ball 1. It’s just the case that if you need to score faster to keep your place in the team, you’re probably going to be thinking about run rate before you’ve even finished walking out to the middle.
To understand whether the first ball change that followed this astronomical rise in boundary hitting is random chance, or a broader change in cricket, I calculated the delta for the first-ball run rate in each of the 5 biggest T20 leagues and The Hundred. The delta is simply the gap between the orange and blue lines in the first graph, but with Run Rate rather than Boundary Percentage.
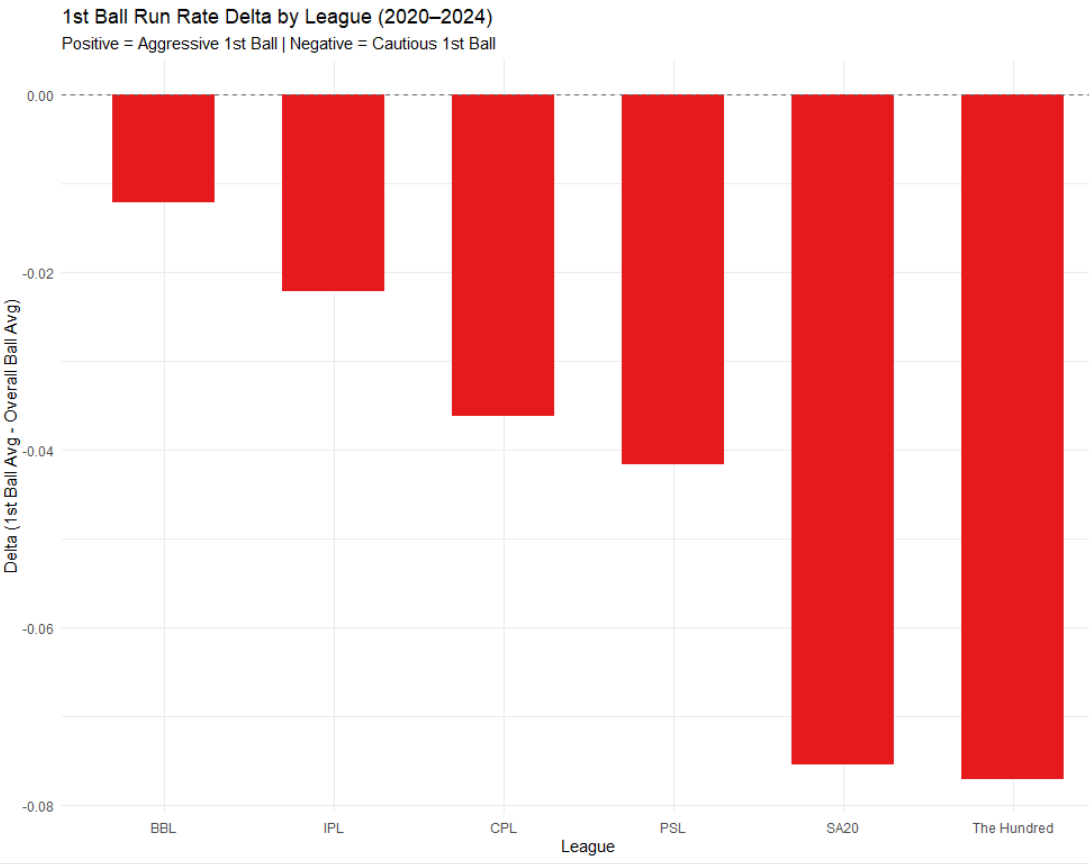
Graph 3: First ball run-rate delta 2020-24. Note that all bars are in the negative direction, meaning lower than average RR. This affirms the truth of the old wisdom globally.
In the year-by-year data, some outlier seasons exist, but when we package up 2020-24 as an average, it’s clear that across the world, fewer runs off the bat are scored on the first ball. From around 0.02 runs less per first ball in the BBL and IPL (equivalent to only 0.4 runs per innings) to 0.075 in the SA20 and The Hundred (equivalent to 1.5 runs lost per innings). Yes, these numbers are small, and you might ask why they matter if it’s only a run per innings played, but what that averaged-out noisy data effect holds is evidence of a psychological phenomenon: the choice to be risk-averse on ball 1. When you consider that set batters and batters finishing an innings are unlikely to take on this mindset, and that many bowlers are likely to bowl weaker ‘loosener’ deliveries in the first balls of overs or spells… in some games and game phases the players taking sighters are rejecting opportunities to get boundaries, in a way that could cost 10 runs one game, and none in another. In the game that it costs 10, it’s a huge deal.
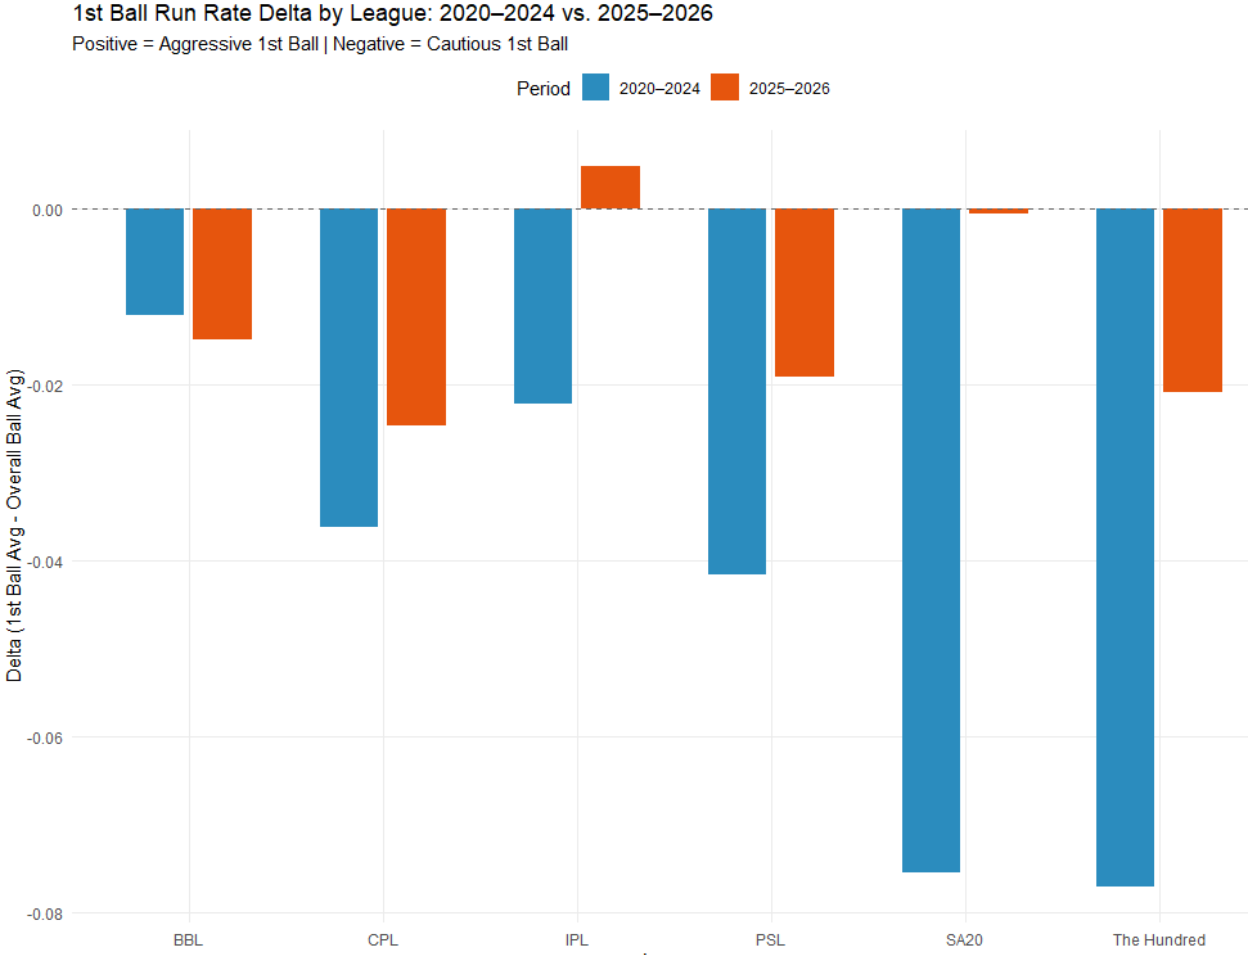
Graph 4: First ball run-rate delta 2020-24 vs 25-26 Comparison. 20-24 in Blue, 25-26 in Orange. All bars in the negative direction, except for the IPL 25-26. Hence, smaller bars represent reductions in first ball inhibition, and movement towards the 0 axis.
Now we’ve established the mindset is global, let’s look at our 2020-24 deltas per league, next to the 25-26 deltas per league. One or two seasons in one league can be luck, or noise in the data. But what we see here, though, is a statistically significant reduction in first-ball sighters across every major league. The one exception is the BBL, which, unlike all the other leagues sampled, has only had 1 season in the 25-26 window. It will be interesting to see where BBL 26-27 lands in this metric.
I’m willing to claim from this result that the ‘sighter’ delivery is becoming a relic across major T20 Cricket tournaments. More and more batters are ready to slash from ball one. I think the positive delta in the IPL may be more than just fluctuations in data too and may become a genuine consistent positive delta. If batters now have no first-ball inhibitions, the data becomes controlled primarily by the quality of delivery, which is likely to be lower in the first ball of an over, and even more so if it’s the first ball of a spell.
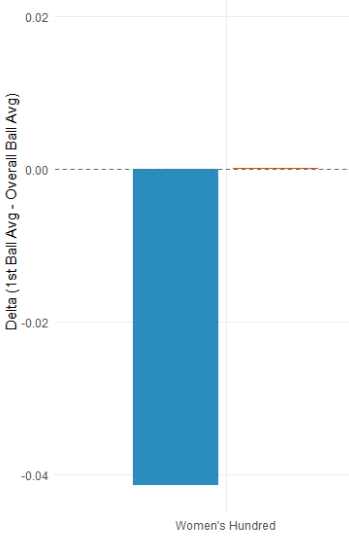
Graph 5: Women’s hundred perfectly fits the trend. The orange bar for 25-26 is almost invisible, as it is so close to 0.00. That in real terms means absolutely no difference between scoring behaviour on ball 1 to other balls.
Then I had to ask… are the women doing this too? If we consider the first ball dip to be purely psychological, then there ought to be no reason why the women can’t eliminate it too. The first values I calculated could not have been more perfect. In the Women’s Hundred, the 2020-24 period had a delta of -0.03 that would’ve placed it right in the middle of the men’s dips for that period… and then for 25+26 they have leveled it to an almost exactly 0.0 delta, fully removing first ball inhibition.
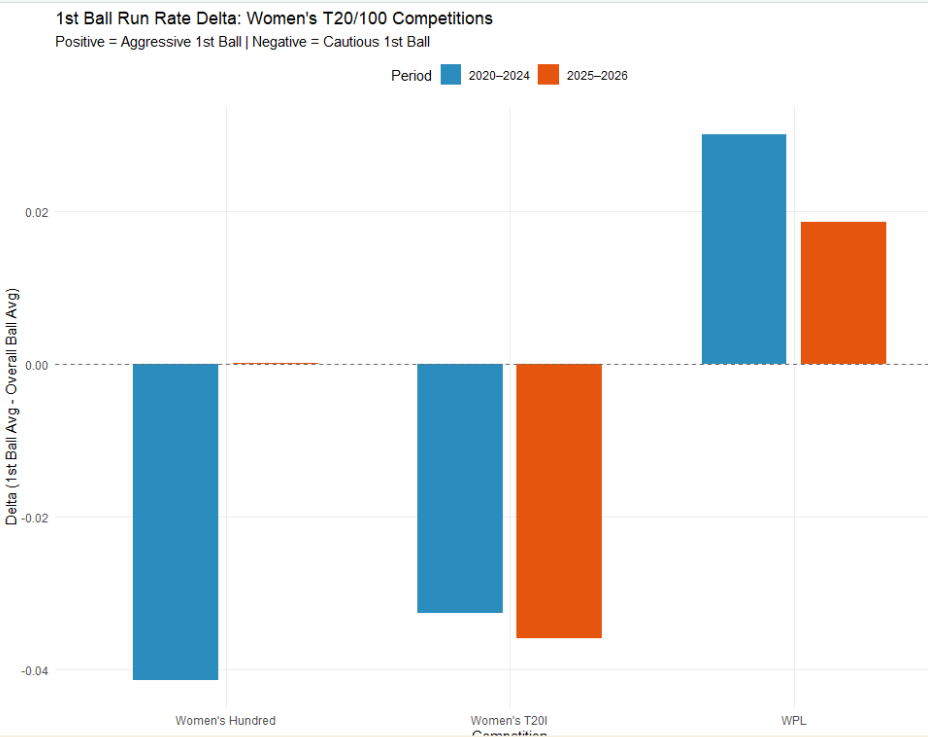
Graph 6: The full plot from which Graph 5 comes. We see no evidence to support the trend in W20Is (data primarily from the world cup) and the WPL results are close to inexplicable.
The problem is, though, I now must be honest and show you this: The Women’s World Cup this summer showed no signs of first ball acceleration. Fine, maybe the fewer balls in The Hundred is a catalyst for the speed-up; maybe risk aversion is higher at a World Cup, because it’s a one-off for your nation. The women’s data gets close to inexplicable once we venture into the WPL, though. I am really struggling to explain why the WPL has a net positive for the first ball of the over, when the rest of women’s cricket historically has always matched the men, across the WBBL, W100 and WT20Is. My best honest guess for the WPL is that the dataset is relatively small, since there are only 6 teams in a compacted format. If anyone reading this does have a theory for why the WPL would not follow the same trends as the rest of mens and womens cricket… I’d love to hear it.
The conclusion for the women’s game then is ambiguous at best, but there is some evidence from The Hundred they are killing the first-ball sighter just like the elite men are.
I considered comparisons of lower-level men’s cricket and such before I realised there is a more important question we must ask…
Is This Actually A Good Thing?
I had got so deep into assuming all change is progress and development, that not once had I stopped to consider that the first ball sighter might be more than just a foolish behind-the-times relic of the gentleman’s game being finally dismantled. Actually, everyone knows settled batters are less likely to get out, so why not get settled against that bowler? Well, this calls for more data…
Has the reduction of first ball inhibition caused more people to get out on the first ball of the over?In short, probably not. Dismissal rates rose in some leagues, but all were well within the margin of error for random variation. Just with the 25-26 datasets being smaller there’s some ambiguity, but there certainly isn’t any evidence that this new found first ball bashing is leading to wickets falling in floods.
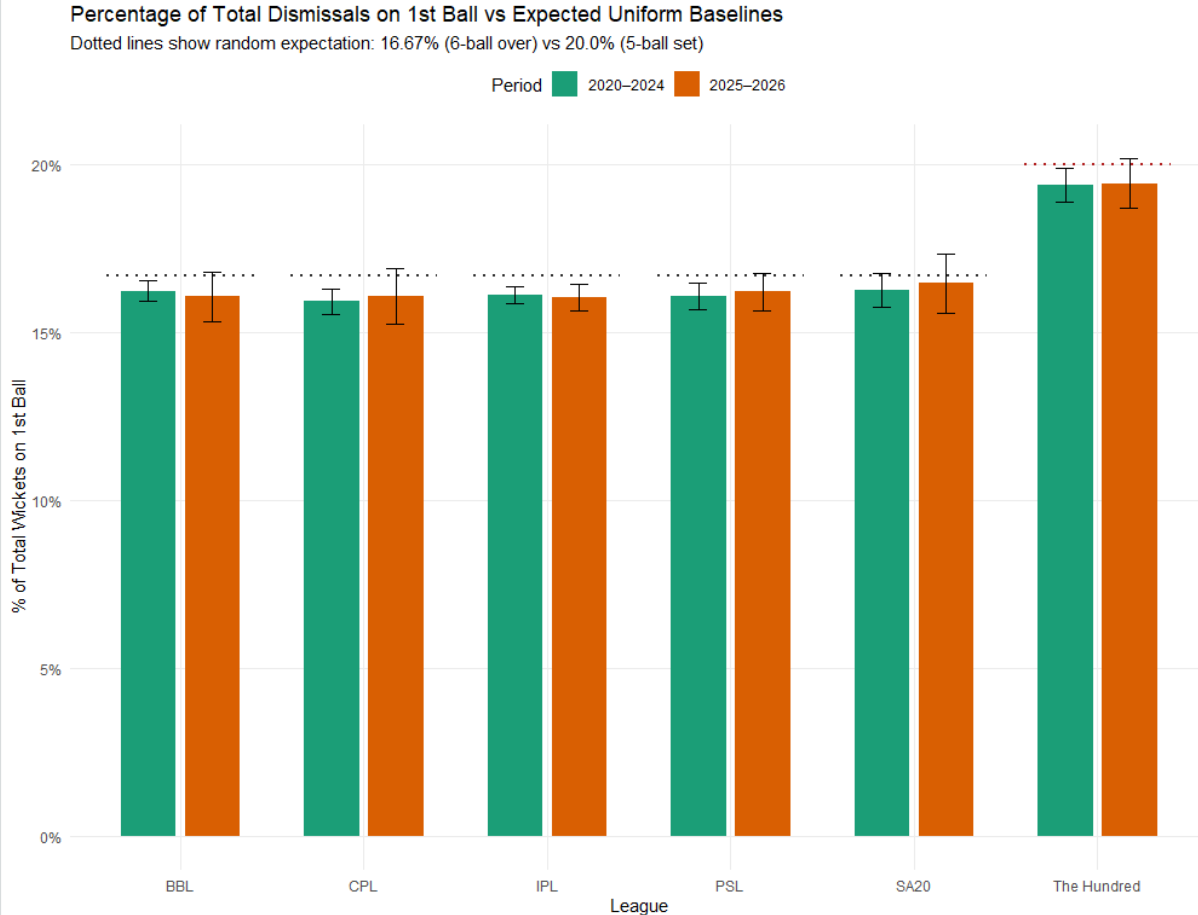
Graph 7: First ball wickets then and now. 20-24 in Green, 25-26 in Orange.
Notably, in all leagues the dismissal rate remained below the dotted line representing what the dismissal rate would be if wickets were evenly distributed between deliveries. Clearly then, players are not suddenly getting out lots on the first ball of the over, even if they are hitting them for more boundaries and more runs.
I think it’s reasonable to suggest then, based on the direction of trend in all major leagues and the tradeoff seeming like more runs without more wickets… the first ball sighter may well become a historical relic, something we carried over from long-form cricket for a while before we worked out how to play T20.
If that is indeed the case, I wish to say a genuine, melancholic so long and farewell to the sighter. I personally loved watching the Gale-type players slowly wind up with a ponderous first 5-10 balls followed by an explosion. There was a period of anticipation and uncertainty, waiting for them to pull the trigger and go. In the very first IPL game where McCullum hit his infamous 158 off 73 balls, he started 0 off 6. Everyone knows it’s McCullum; he’s going to start bashing soon… right? And then when it happened, it was just that bit better than it ever could’ve been if he’d been 12 off 6 to start.
If that’s gone, I will miss it.